STEM Math Connections Explorer
Explore how calculus ideas support advanced courses in undergraduate STEM programs.
About
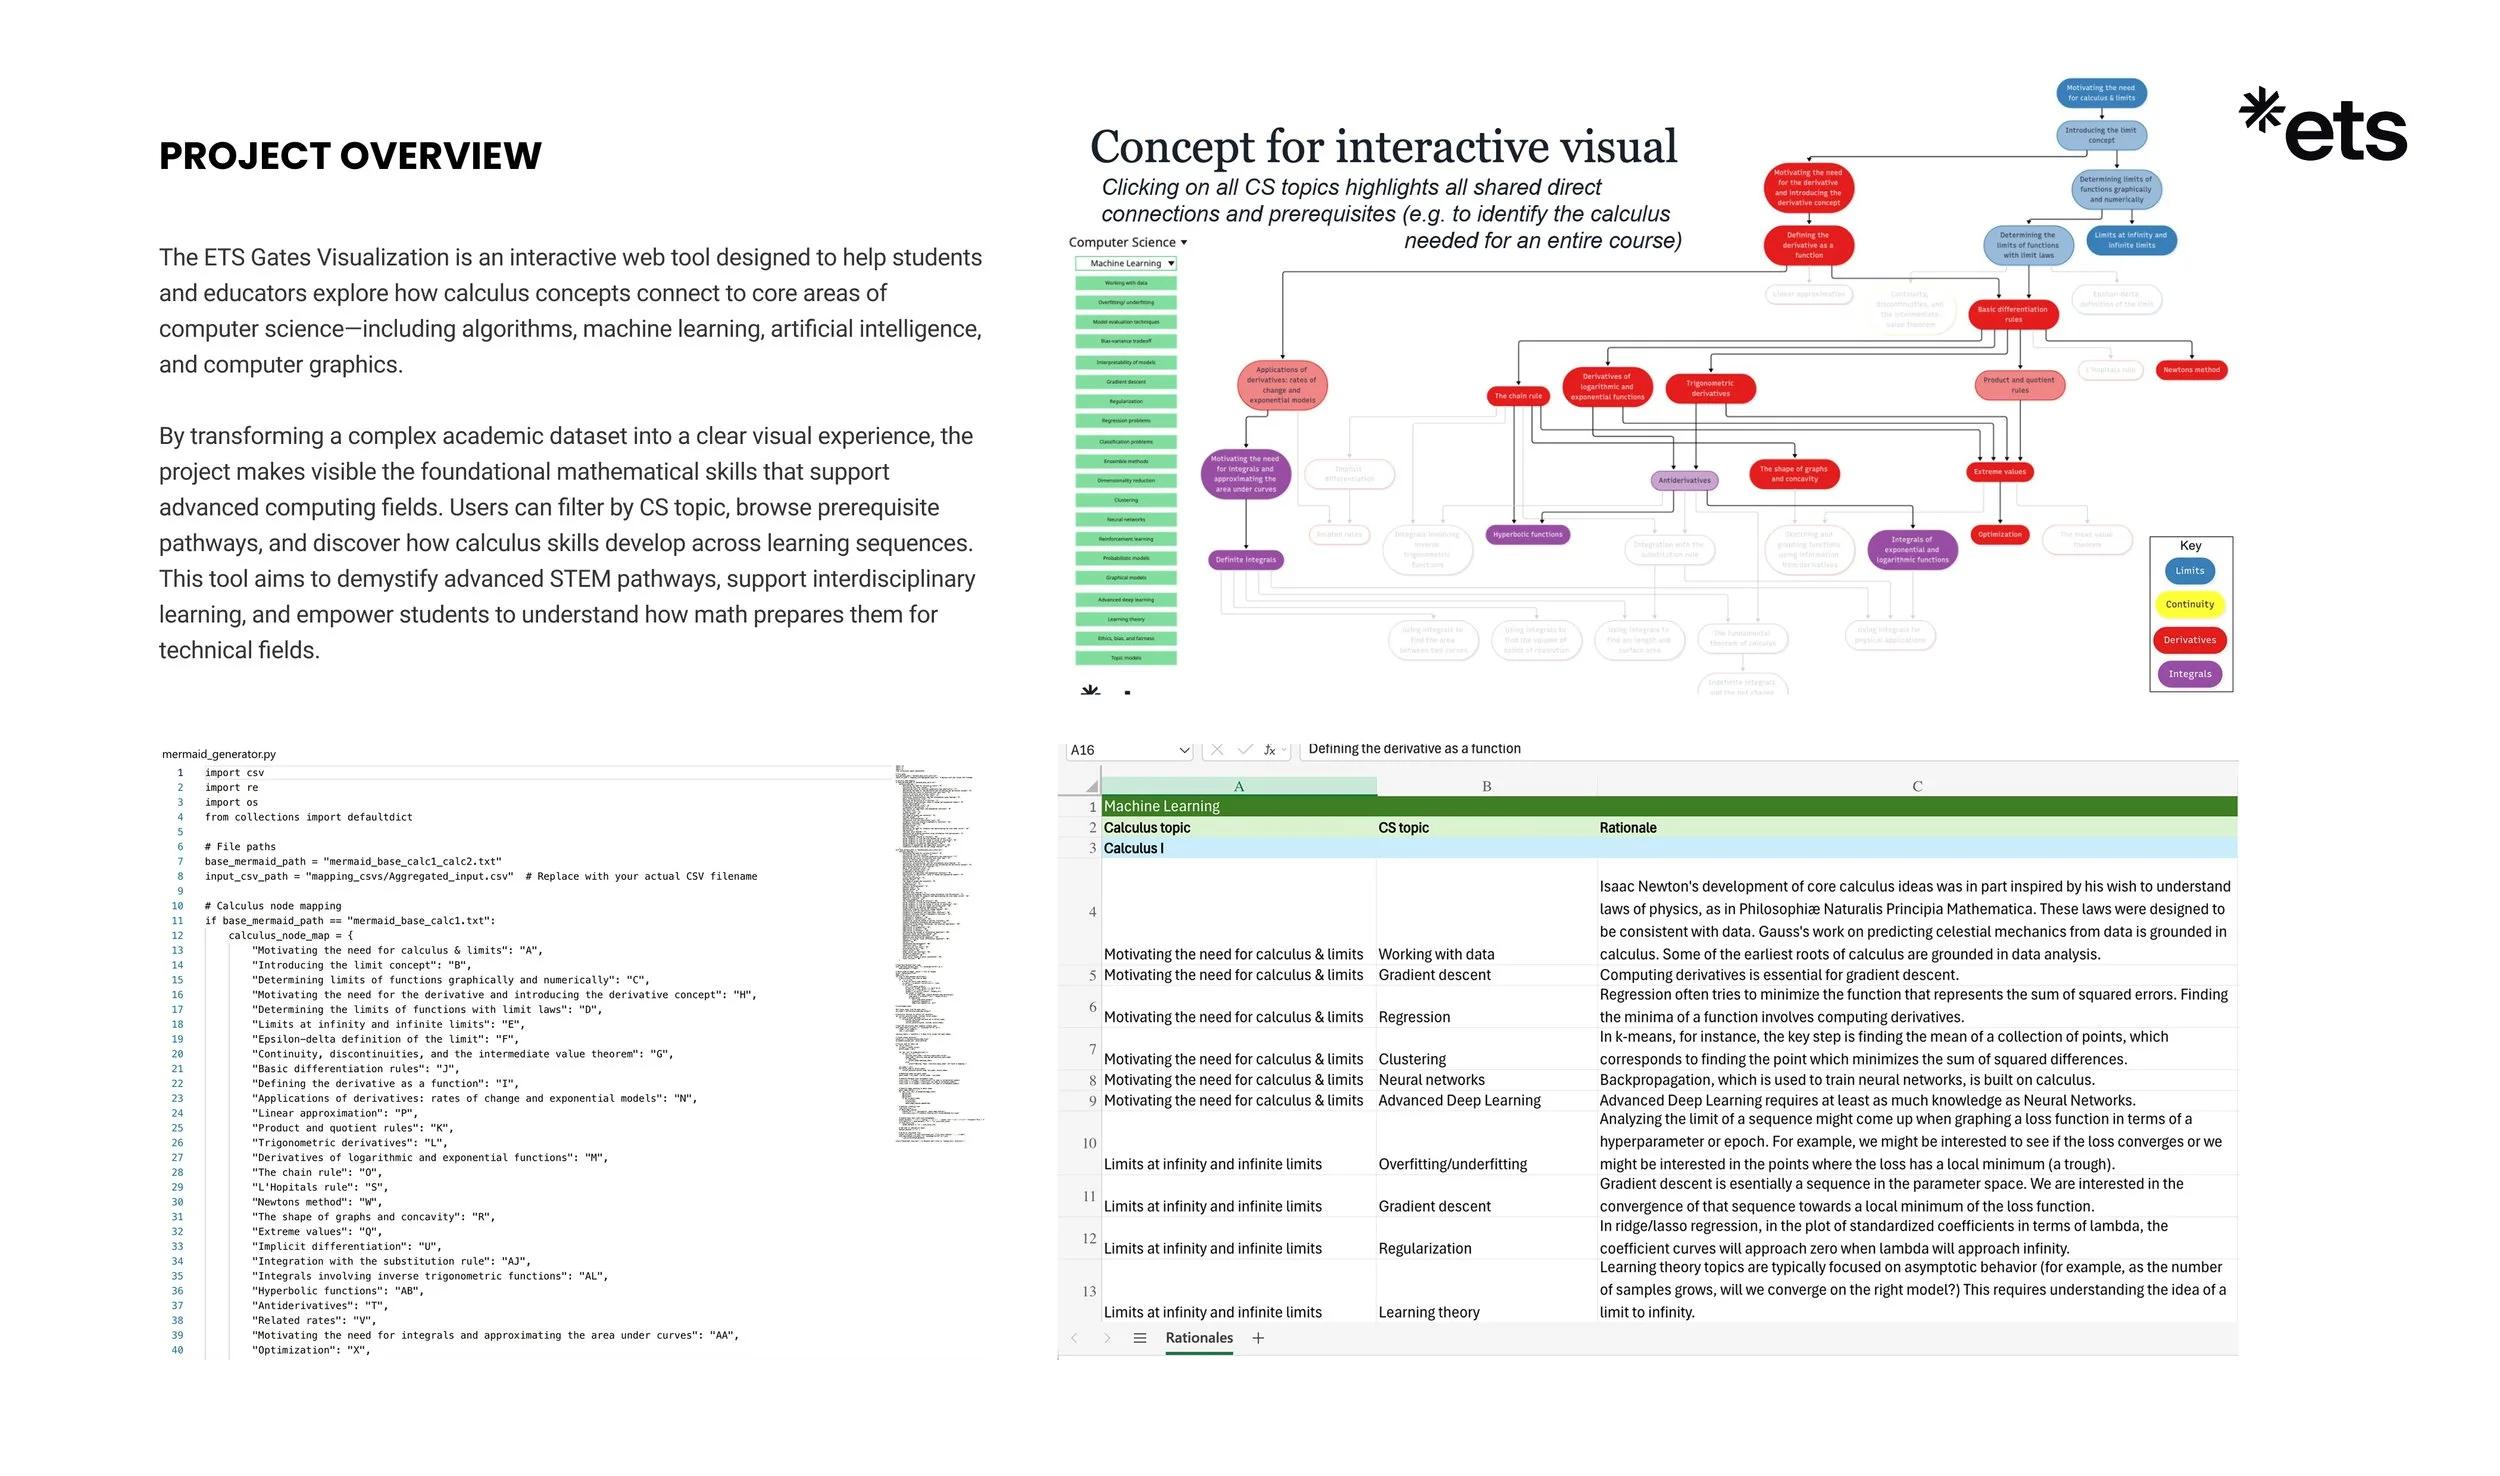
The Degree Mapping Project explores how calculus actually shows up in students’ degree pathways.
Calculus is a foundational requirement for many STEM and near‑STEM majors, yet students and instructors often experience a disconnect between what is taught in calculus courses and how mathematics is later used in advanced, discipline‑specific coursework. The Degree Mapping Project addresses this disconnect by making visible how key concepts from Calculus I and Calculus II connect to advanced courses in undergraduate degree programs.
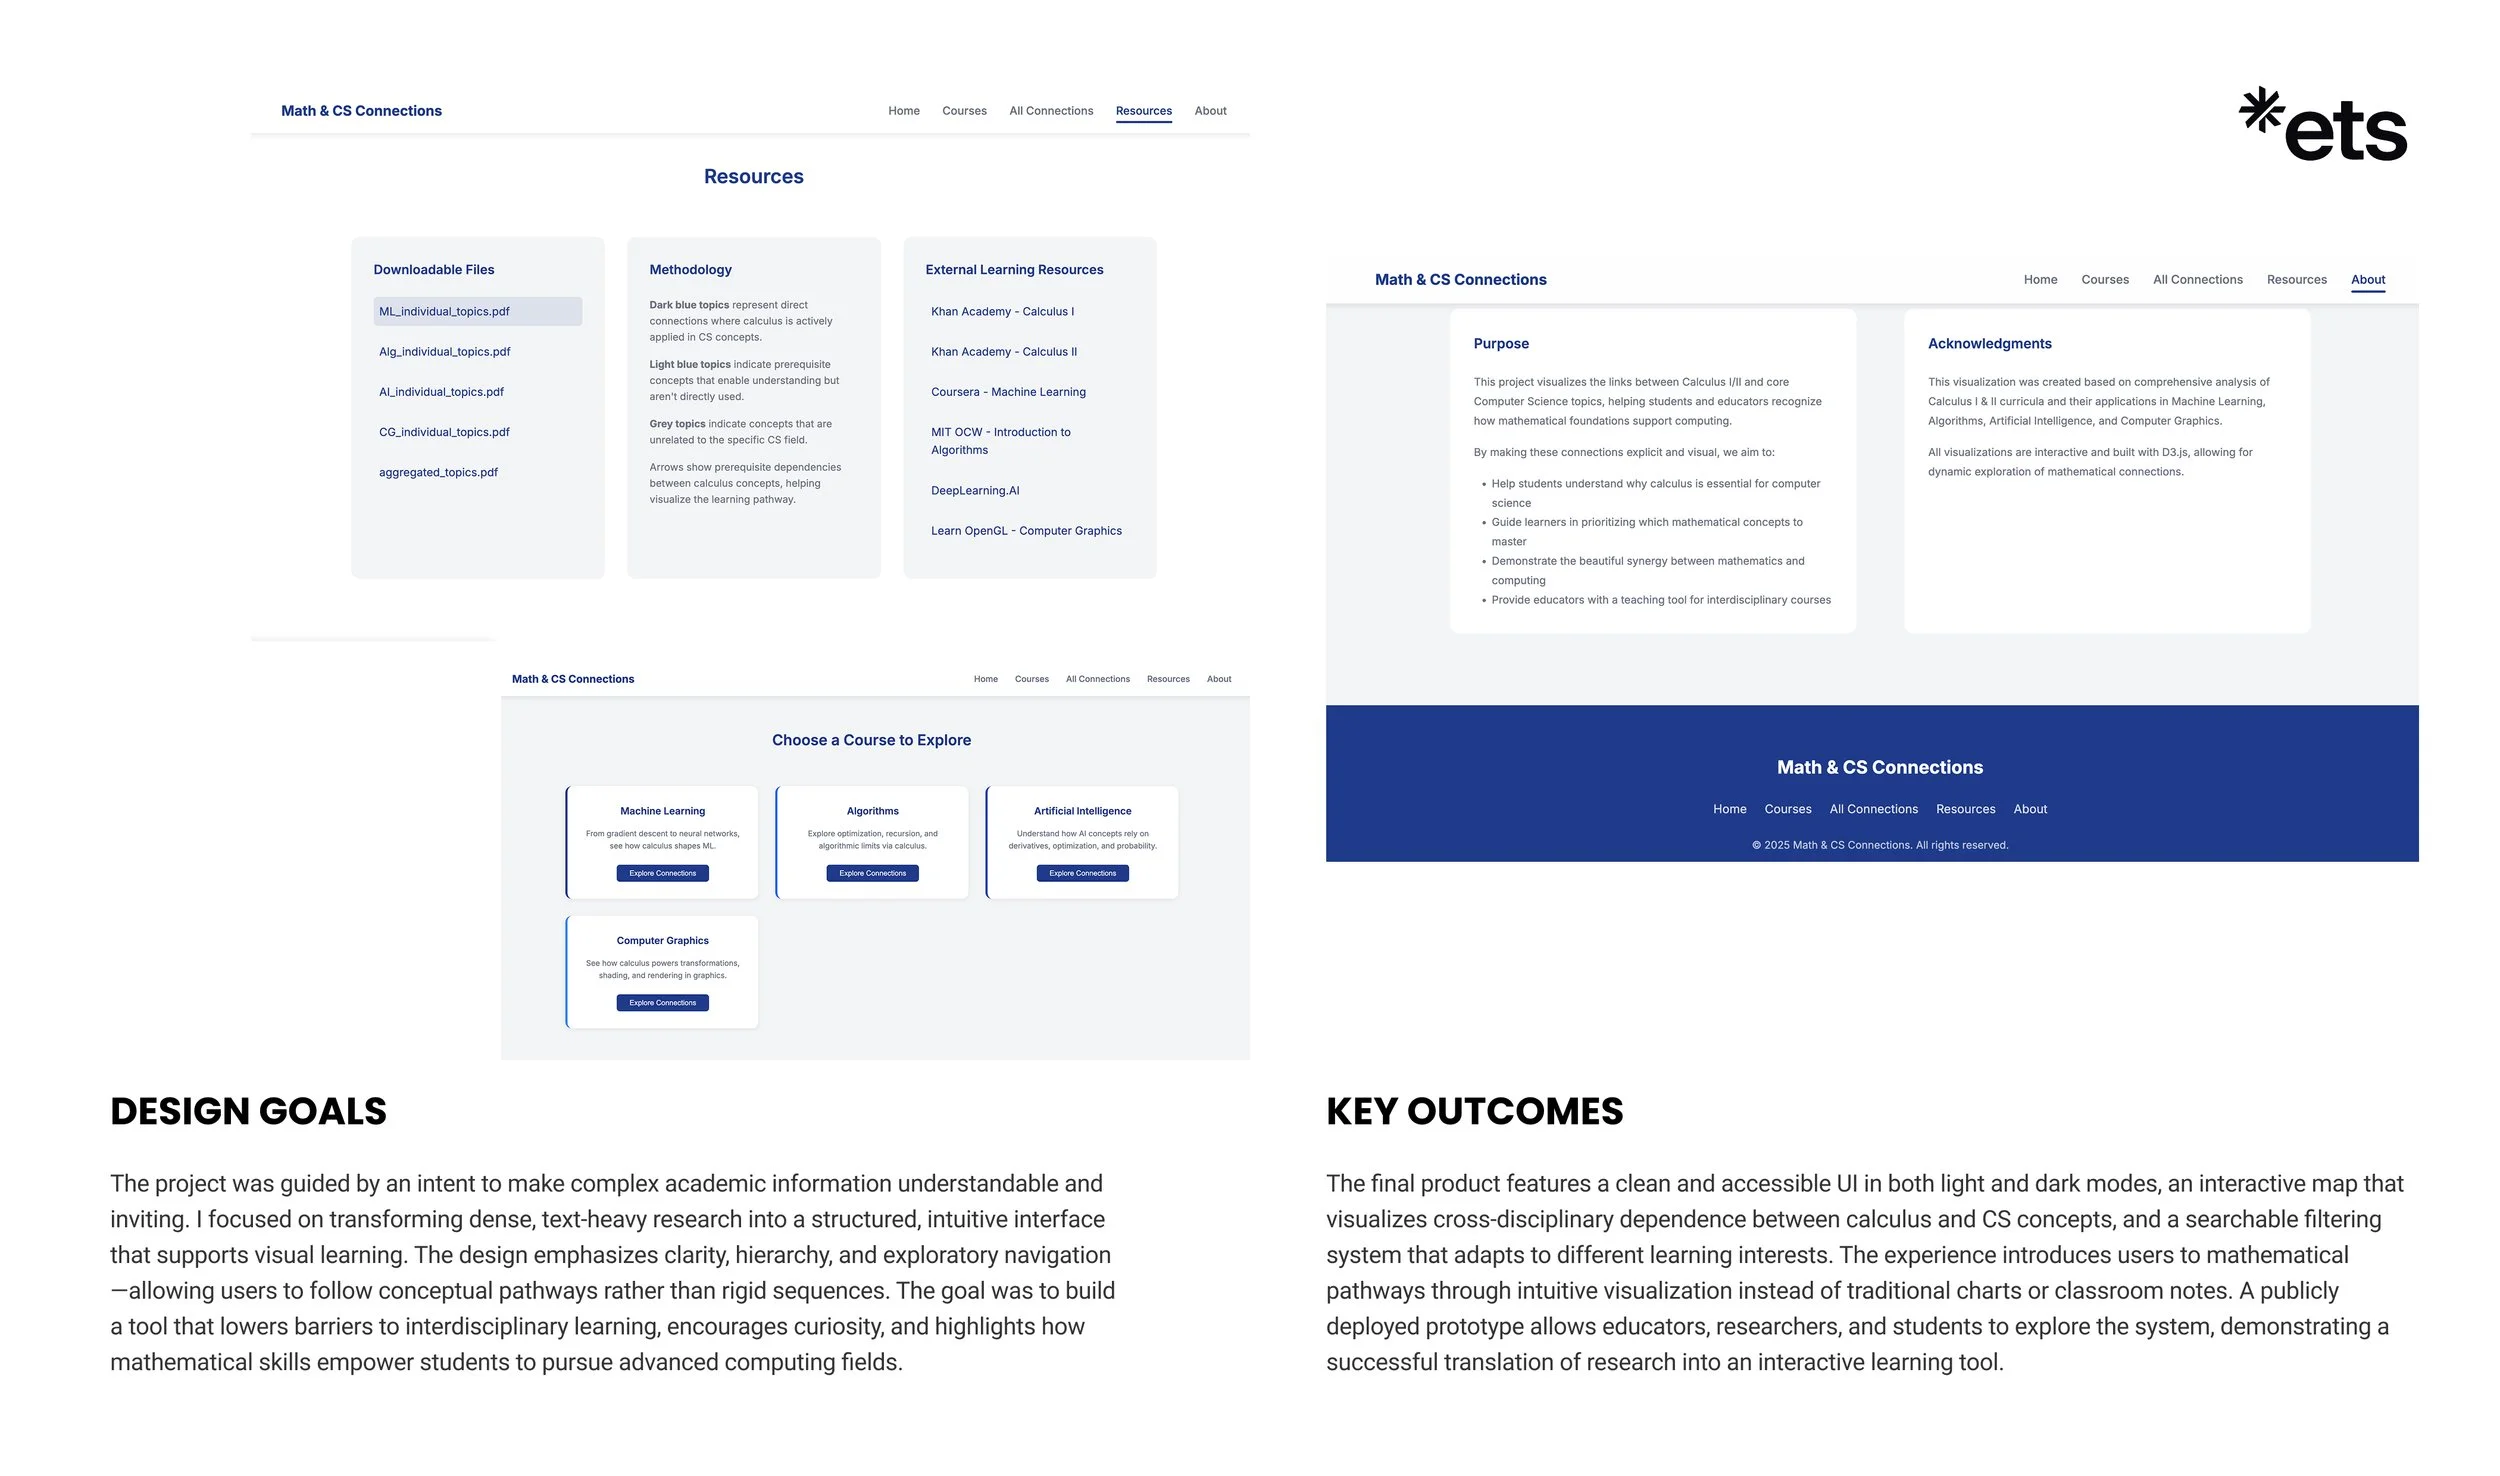
This website presents interactive mappings and supporting resources that trace relationships between calculus concepts and advanced courses in Computer Science and Mechanical Engineering. Drawing on analyses of course syllabi, textbooks, and expert review, the mappings highlight which calculus ideas are most relevant for particular courses, where calculus plays a limited role, and how prerequisite structures shape students’ progress through degree programs. The site is intended as a resource for researchers, instructors, curriculum designers, advisors, and others interested in strengthening alignment between gateway mathematics and postsecondary pathways.
-
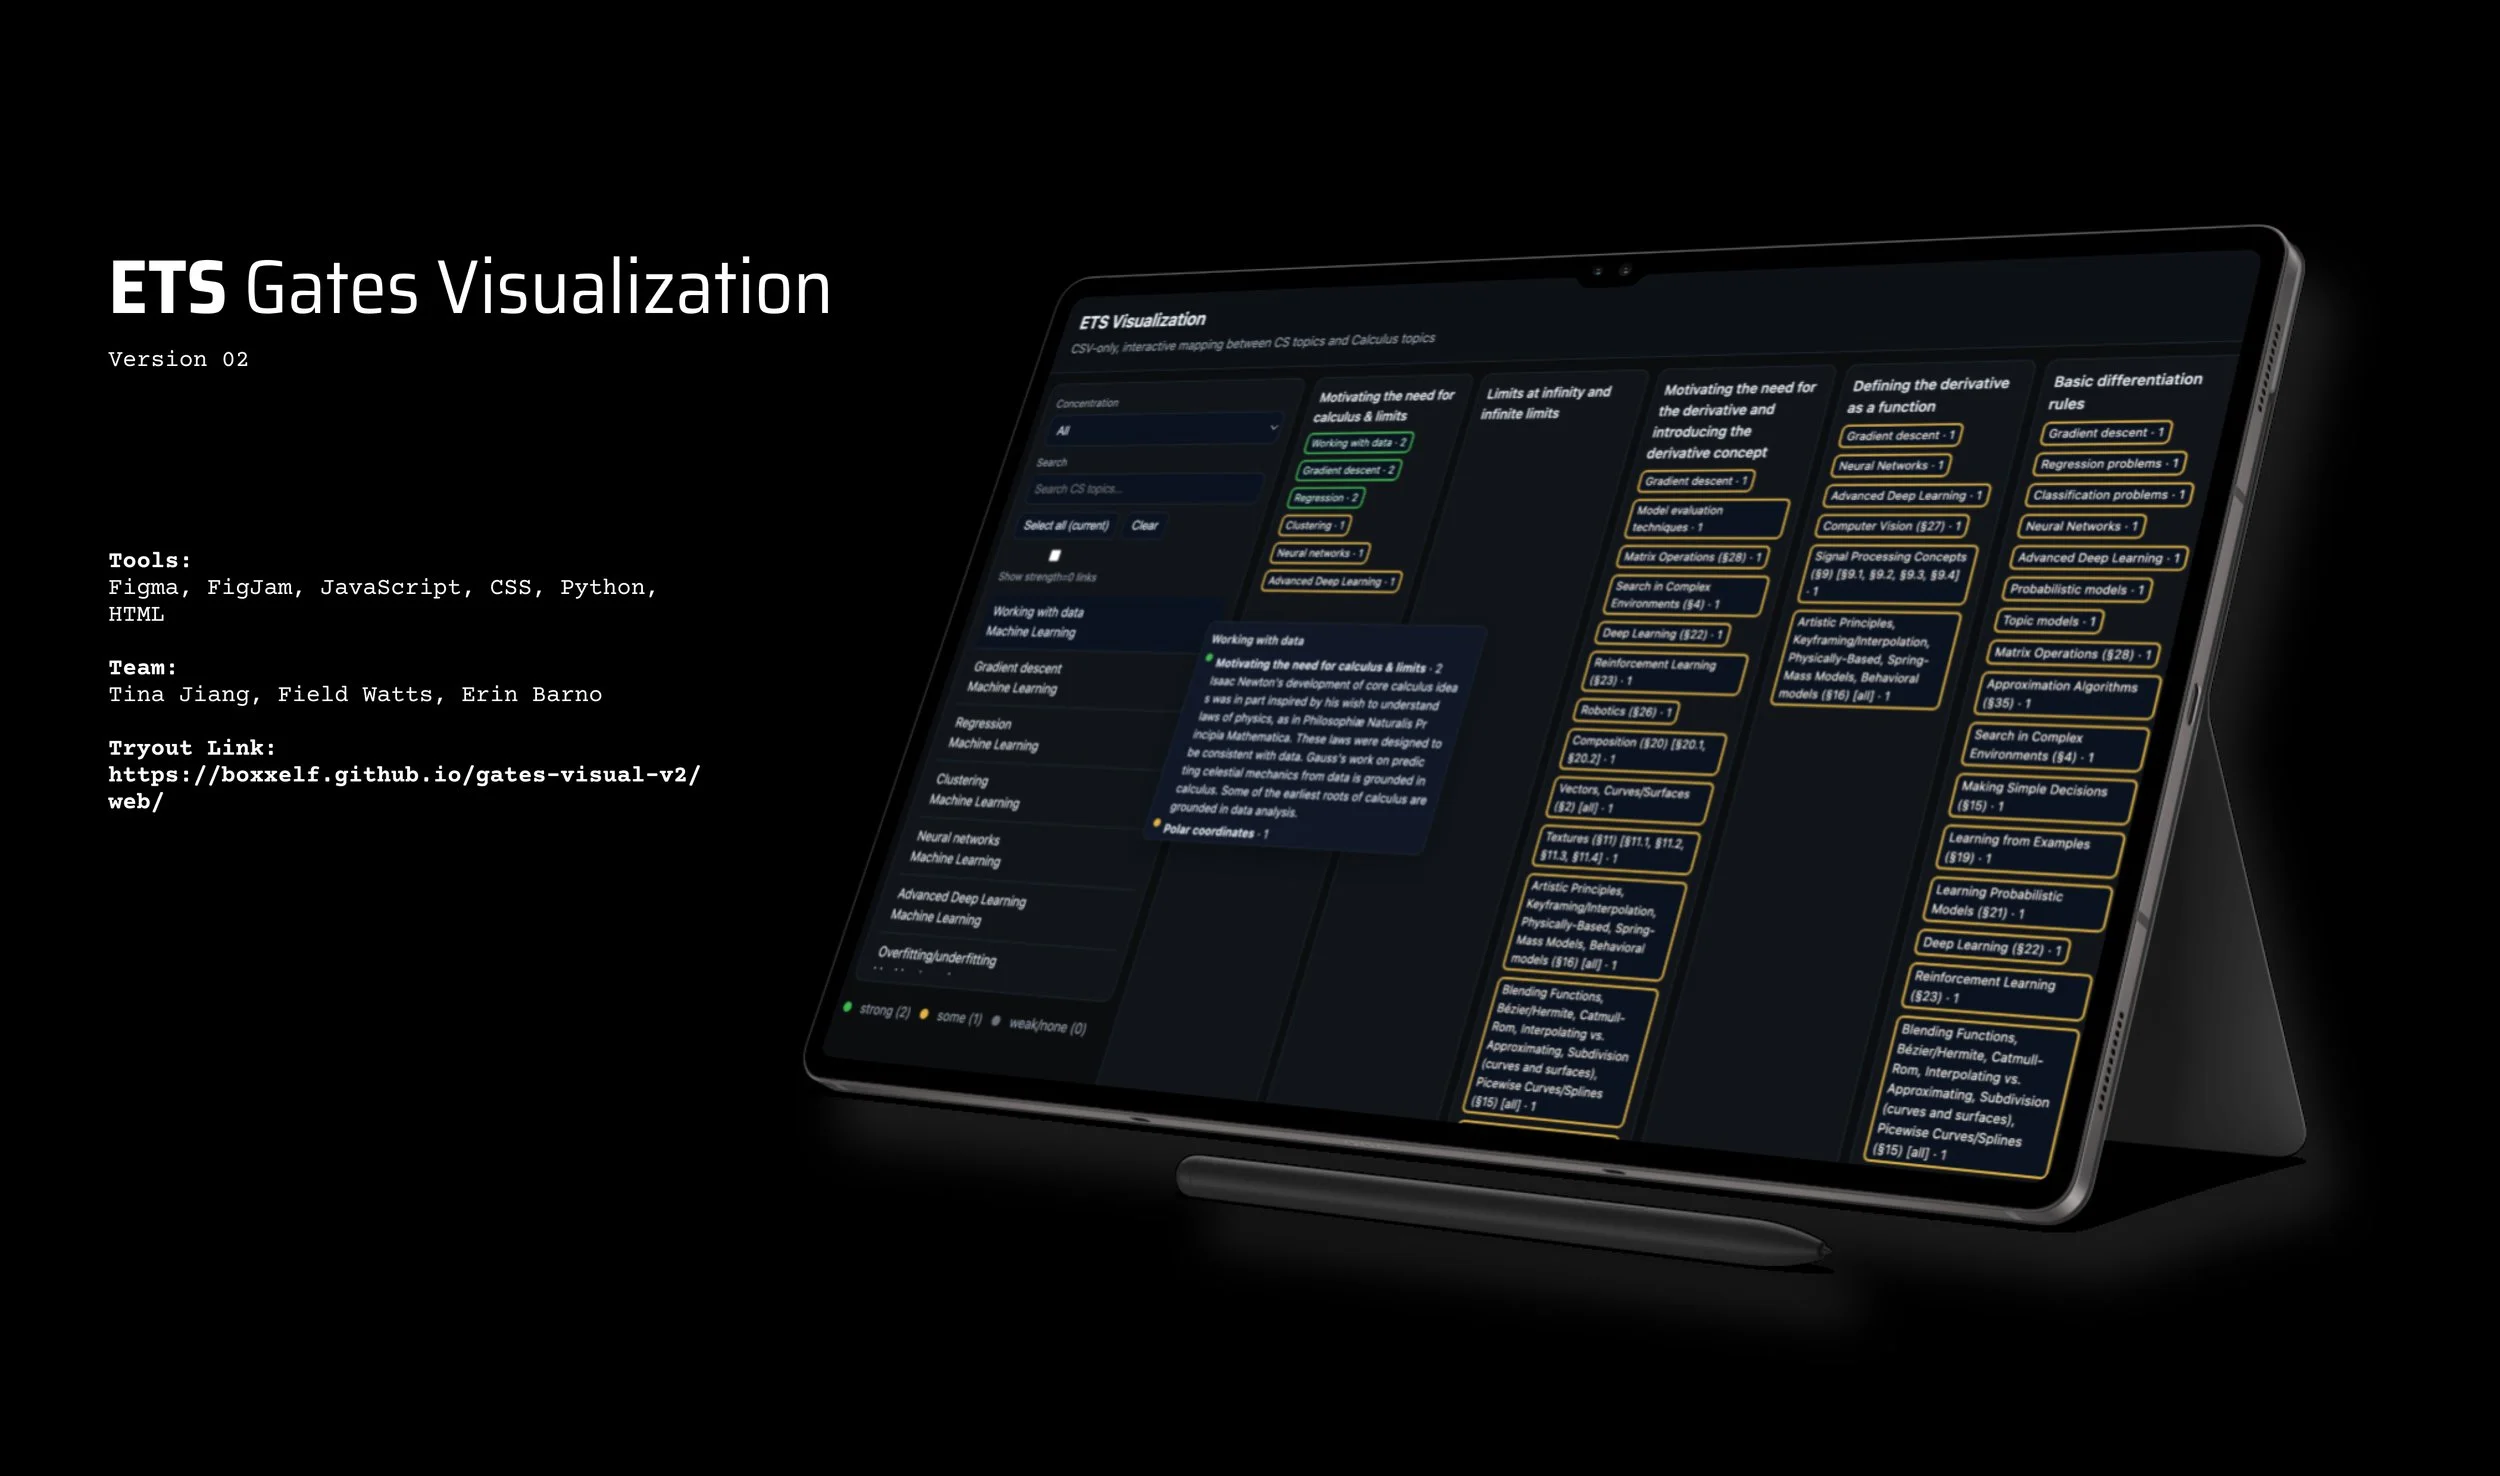
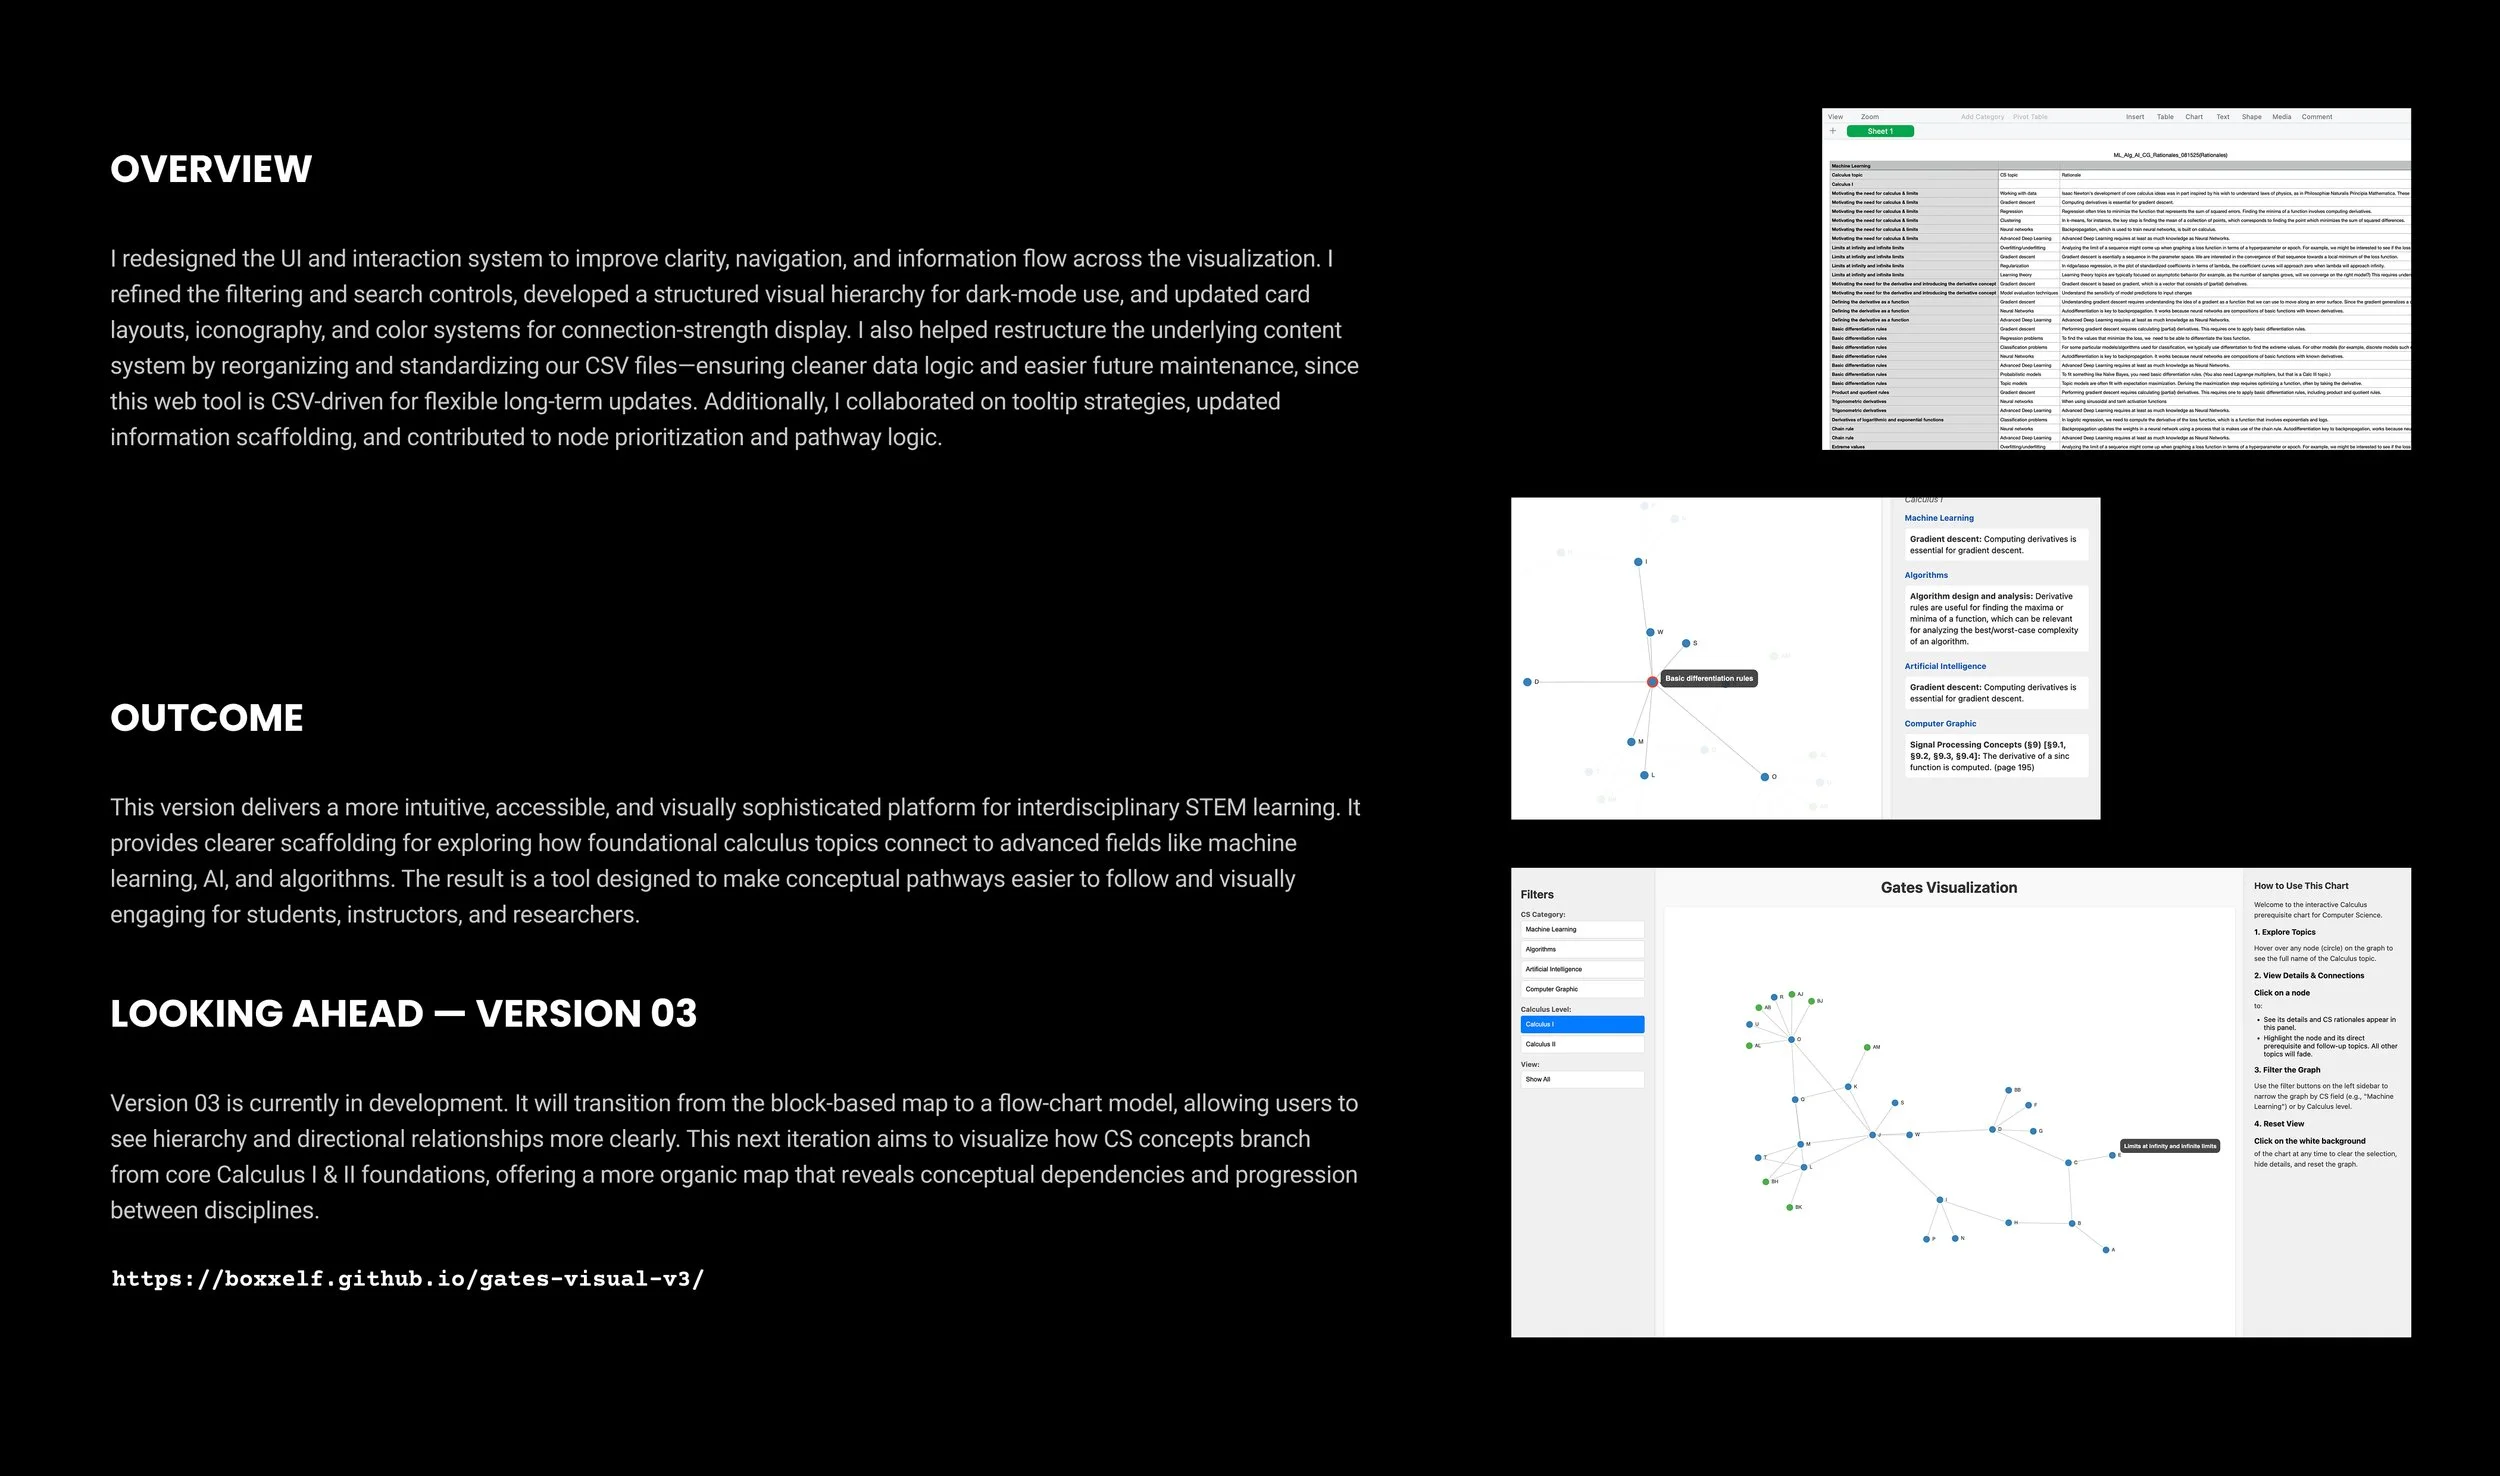
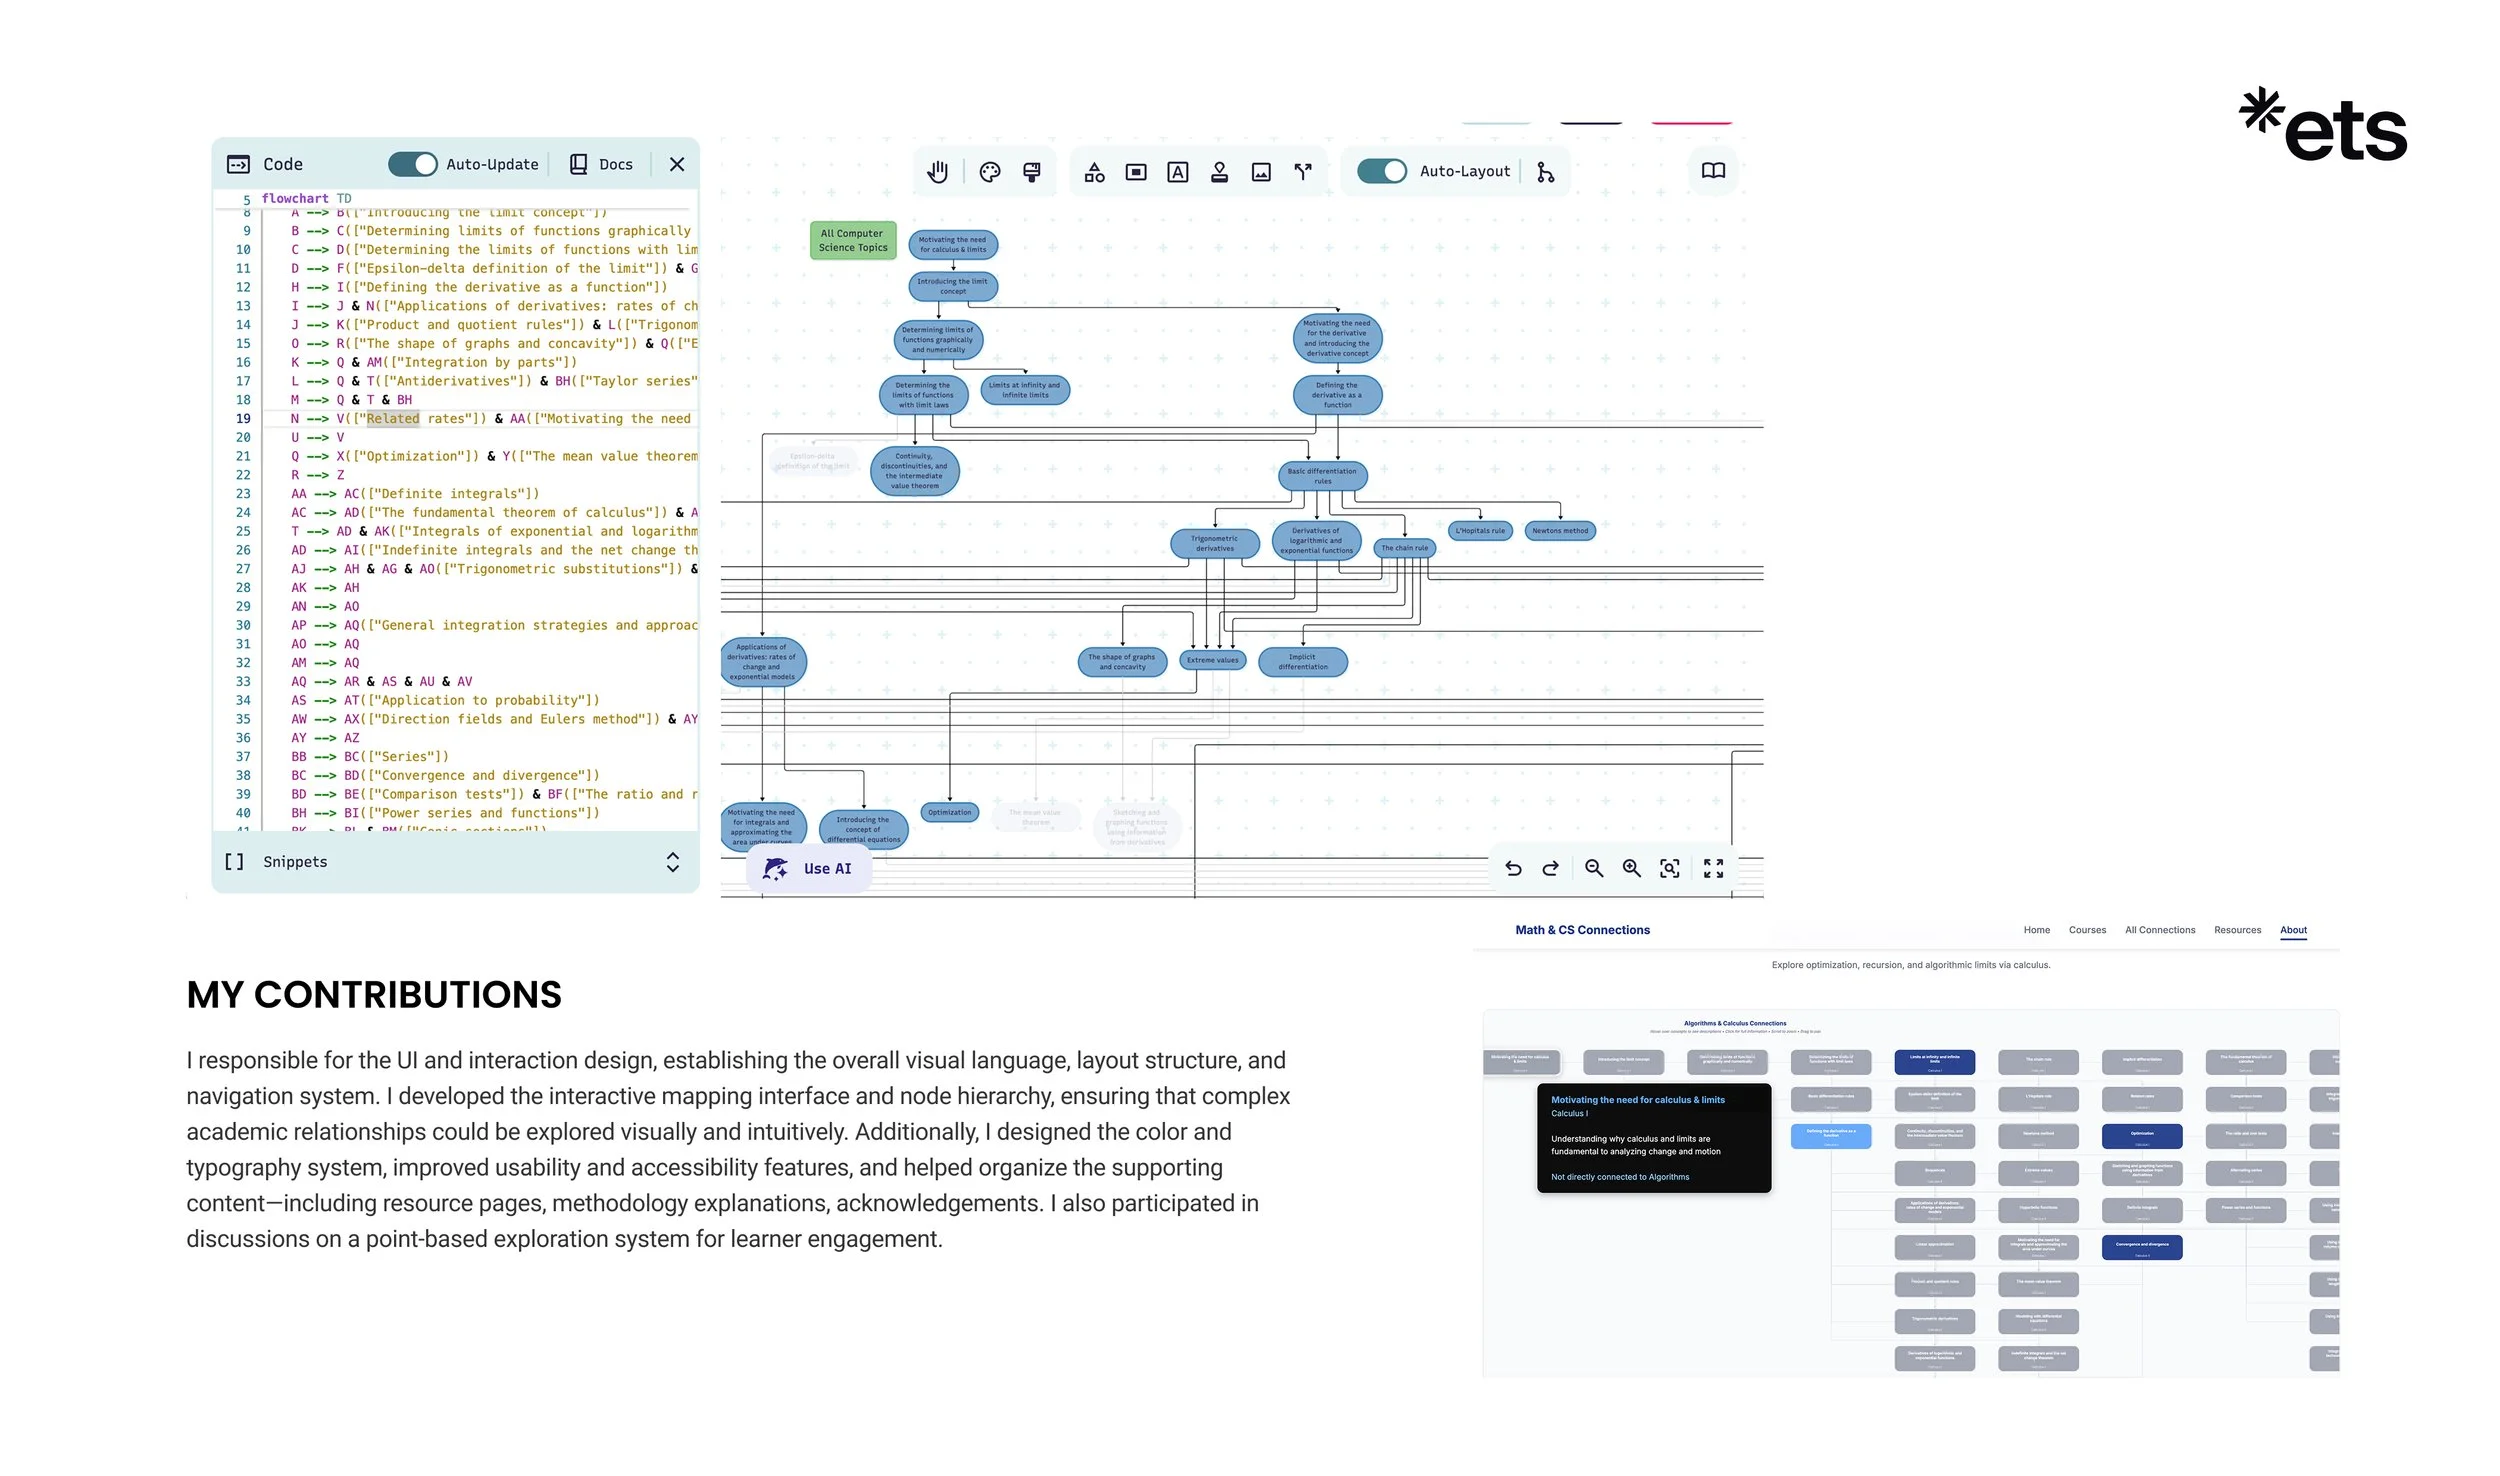
At the center of the experience is a D3.js-based force-directed visualization that renders a dynamic concept network of Calculus topics and their relationships. Users can select one or multiple CS topics to generate relevant Calculus concept sets in real time, allowing the visualization to shift from broad discovery to focused inquiry.
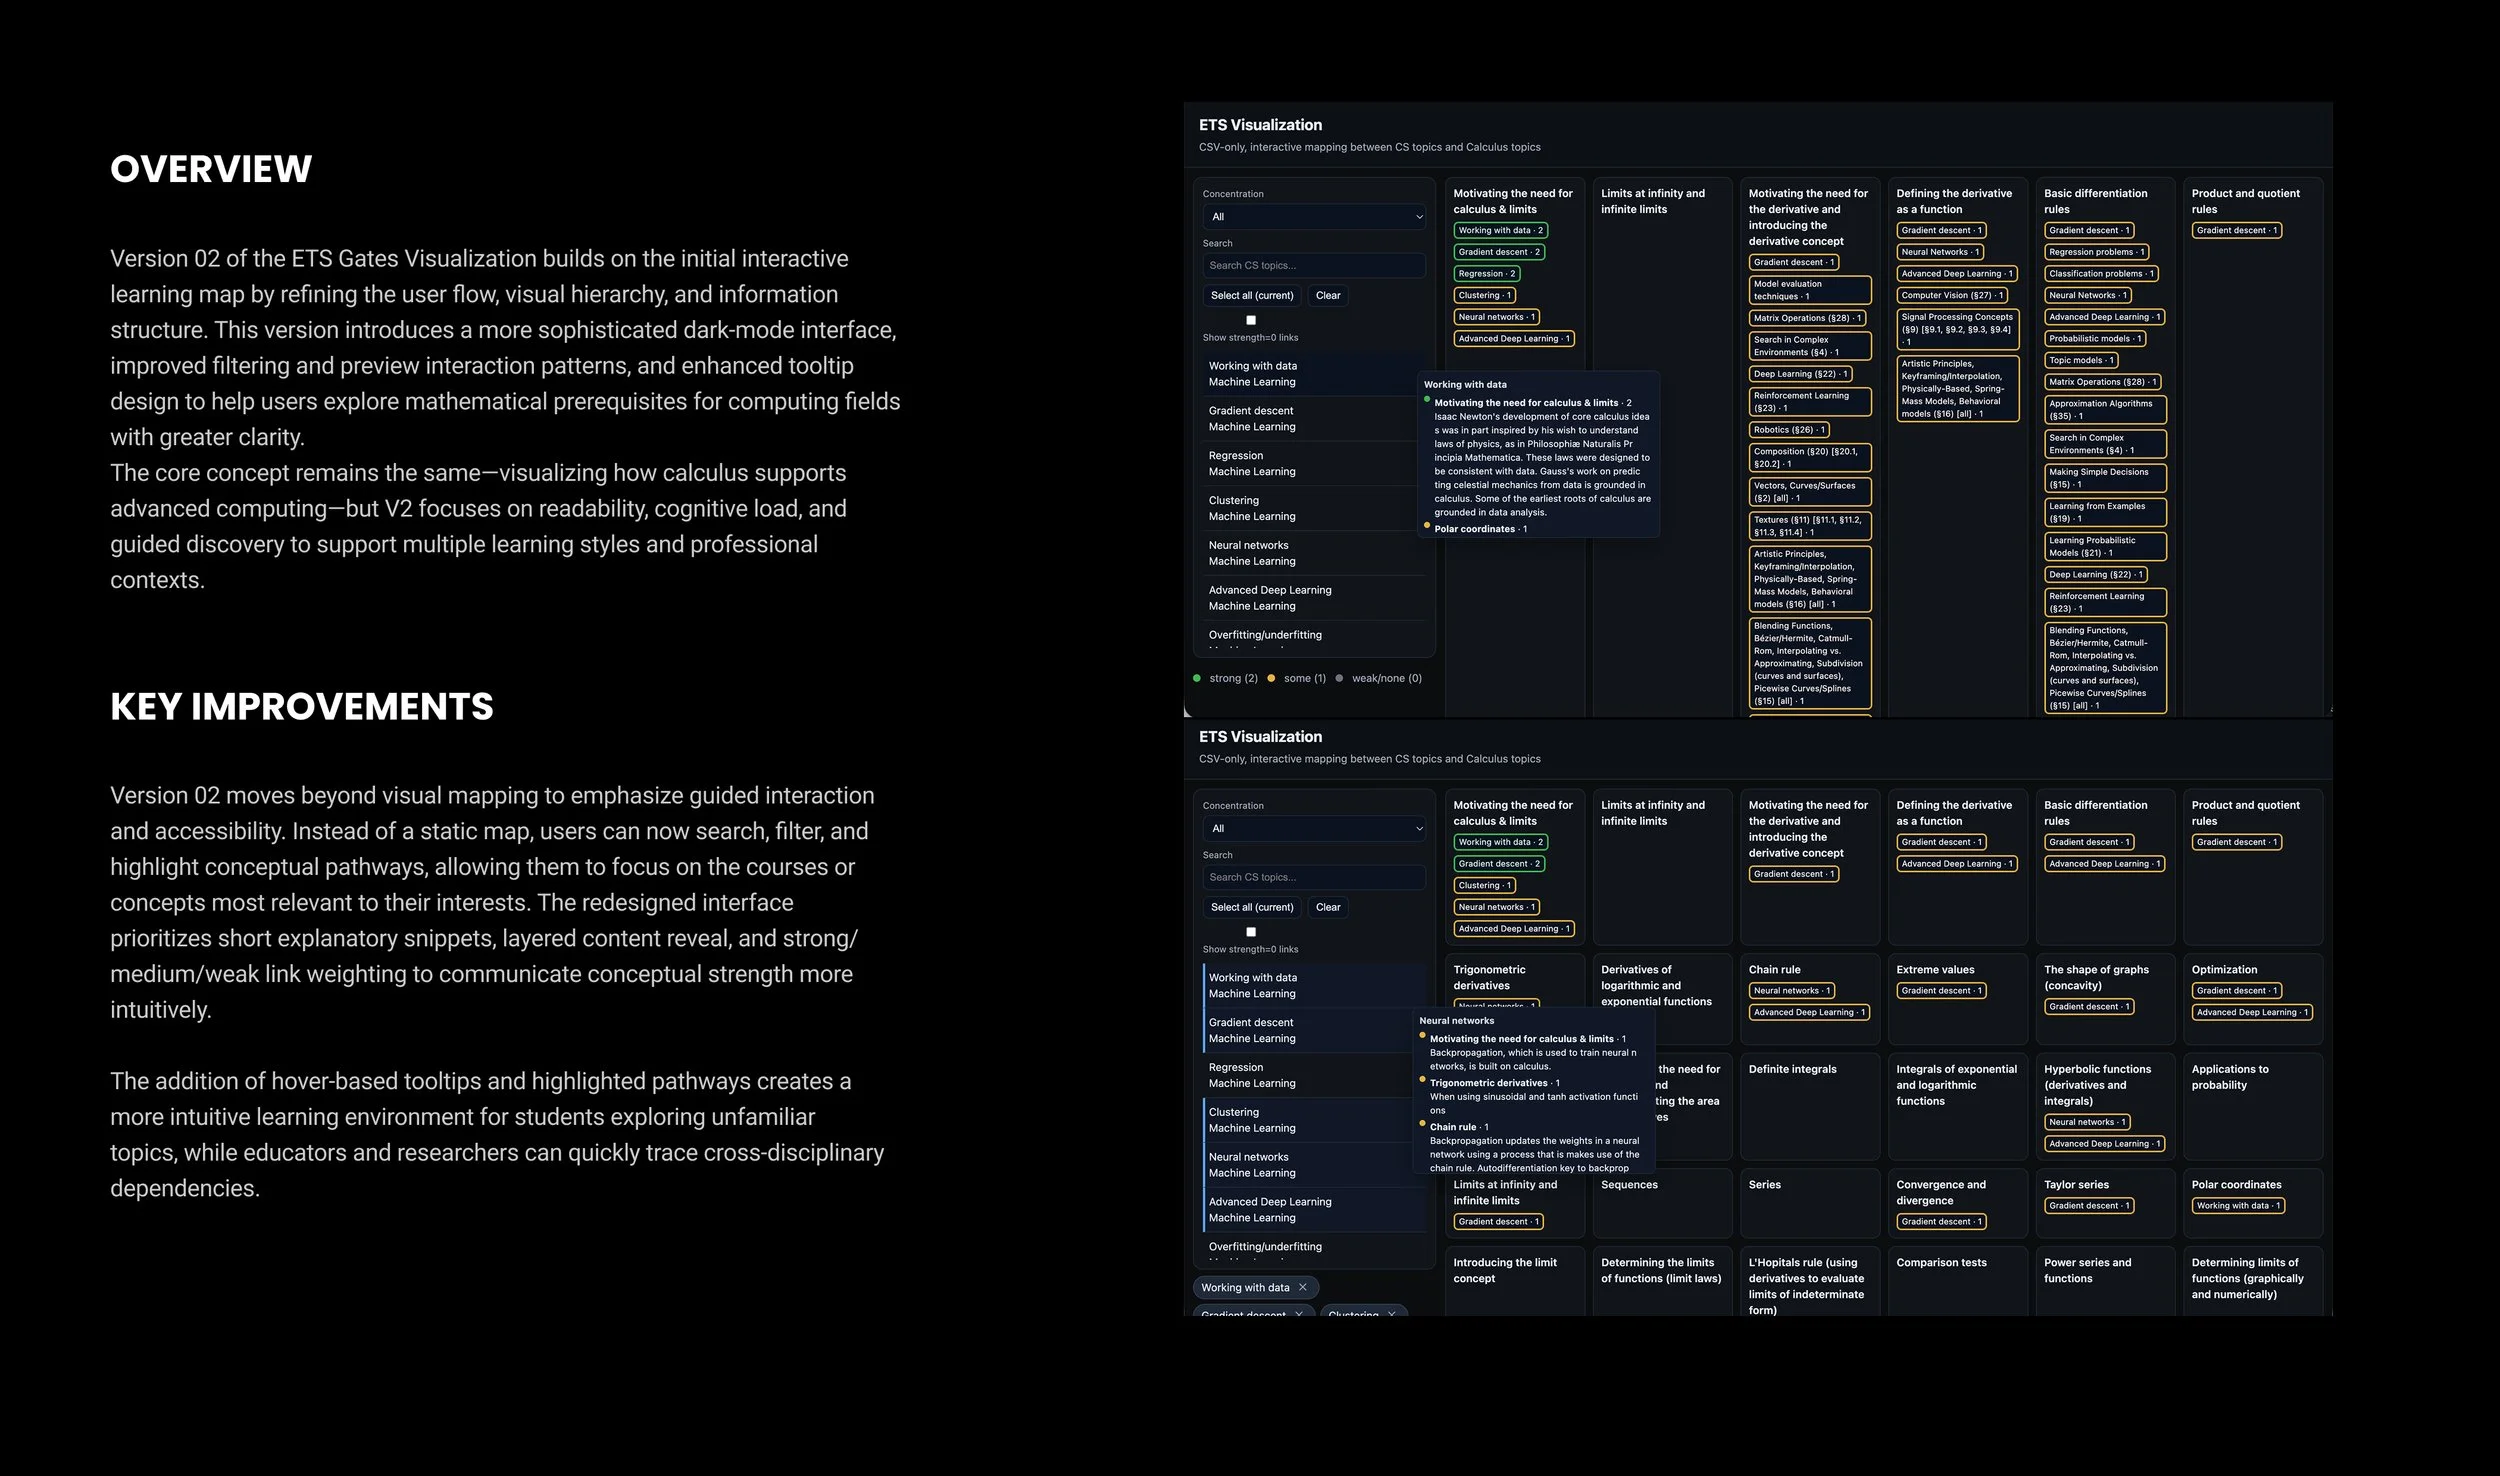
To support different exploration behaviors, the application provides two complementary view modes. A List View ranks Calculus concepts by connection strength to selected CS topics, enabling quick review and comparison. A Concept Map View presents the complete interactive network with zooming and panning, supporting deeper discovery across topic clusters. Each connection includes a short, structured explanation that clarifies how the Calculus concept is applied within the CS context, transforming the visualization into an explainable learning and curriculum tool rather than a purely visual map.
-
The Explorer is built as a front-end-only application using HTML5, CSS3, and vanilla JavaScript, without requiring a backend server. Interactive rendering and real-time filtering are implemented using D3.js v7, enabling smooth graph behaviors and responsive exploration even across large datasets.
The interface is designed to be responsive across screen sizes and is optimized for static deployment platforms such as GitHub Pages, making the project lightweight, accessible, and easy to distribute.
-
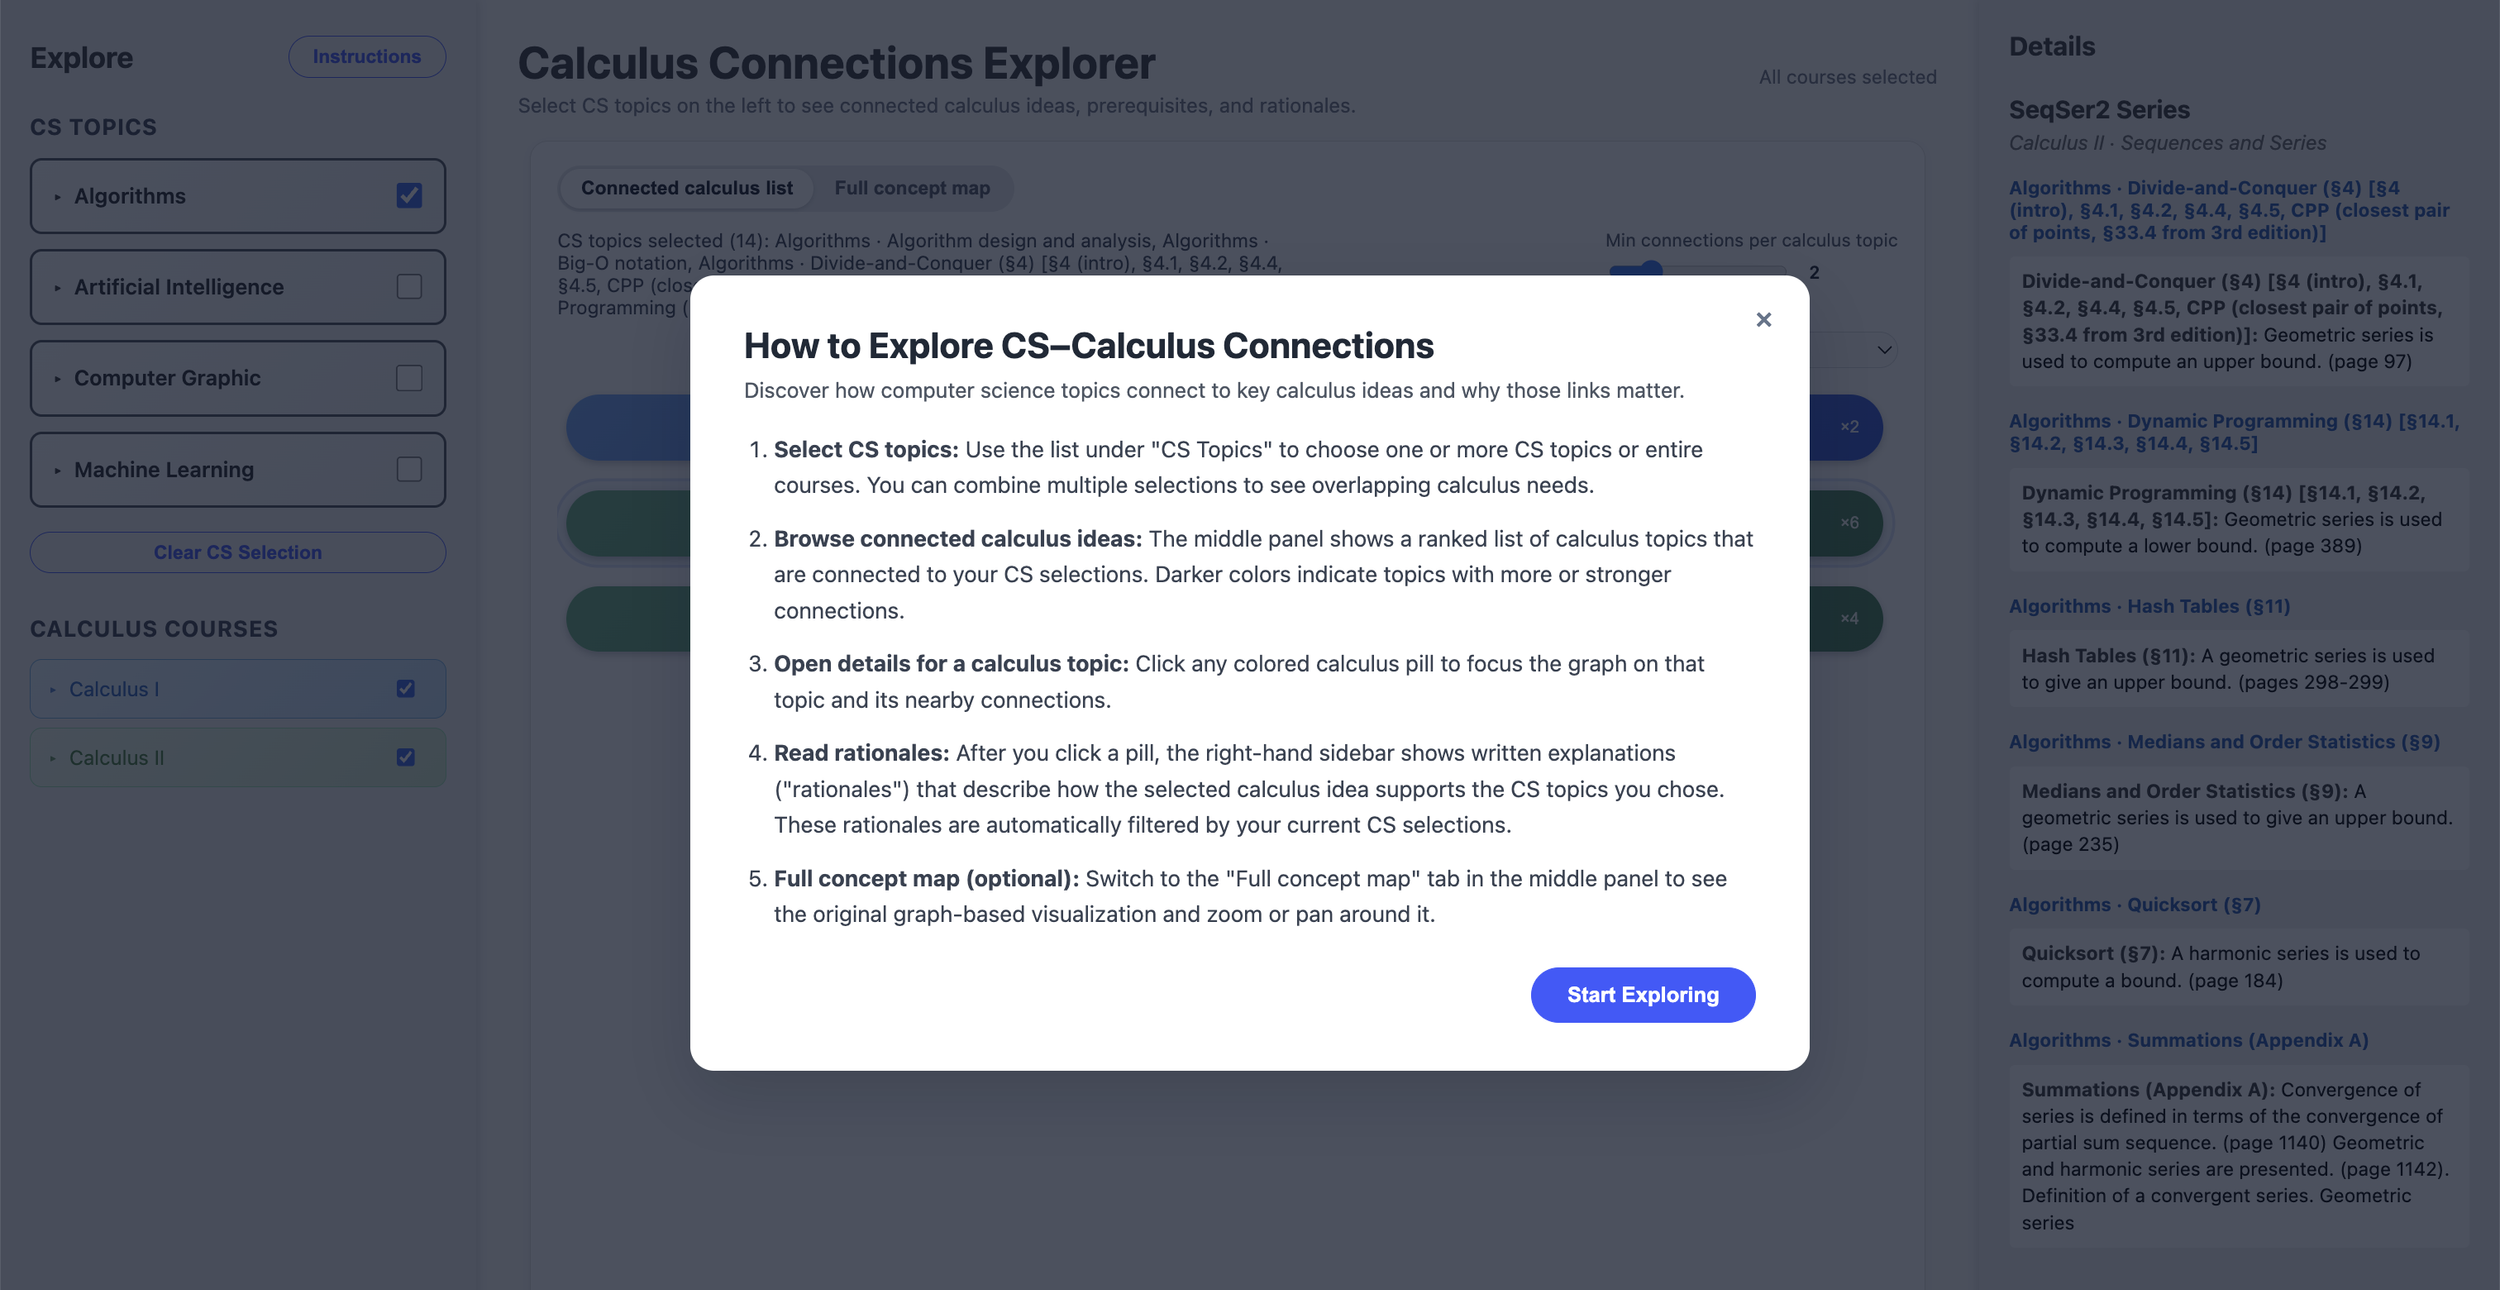
A key technical challenge was managing hundreds of nodes and edges while maintaining fast interaction performance. The project also emphasizes usability for non-technical audiences by integrating onboarding guidance, informative empty states, and animation transitions that help users understand changes in the graph as they filter or explore. The overall structure is data-driven and built from real curriculum topic datasets, enabling multi-level organization across courses, core ideas, and topic connections.

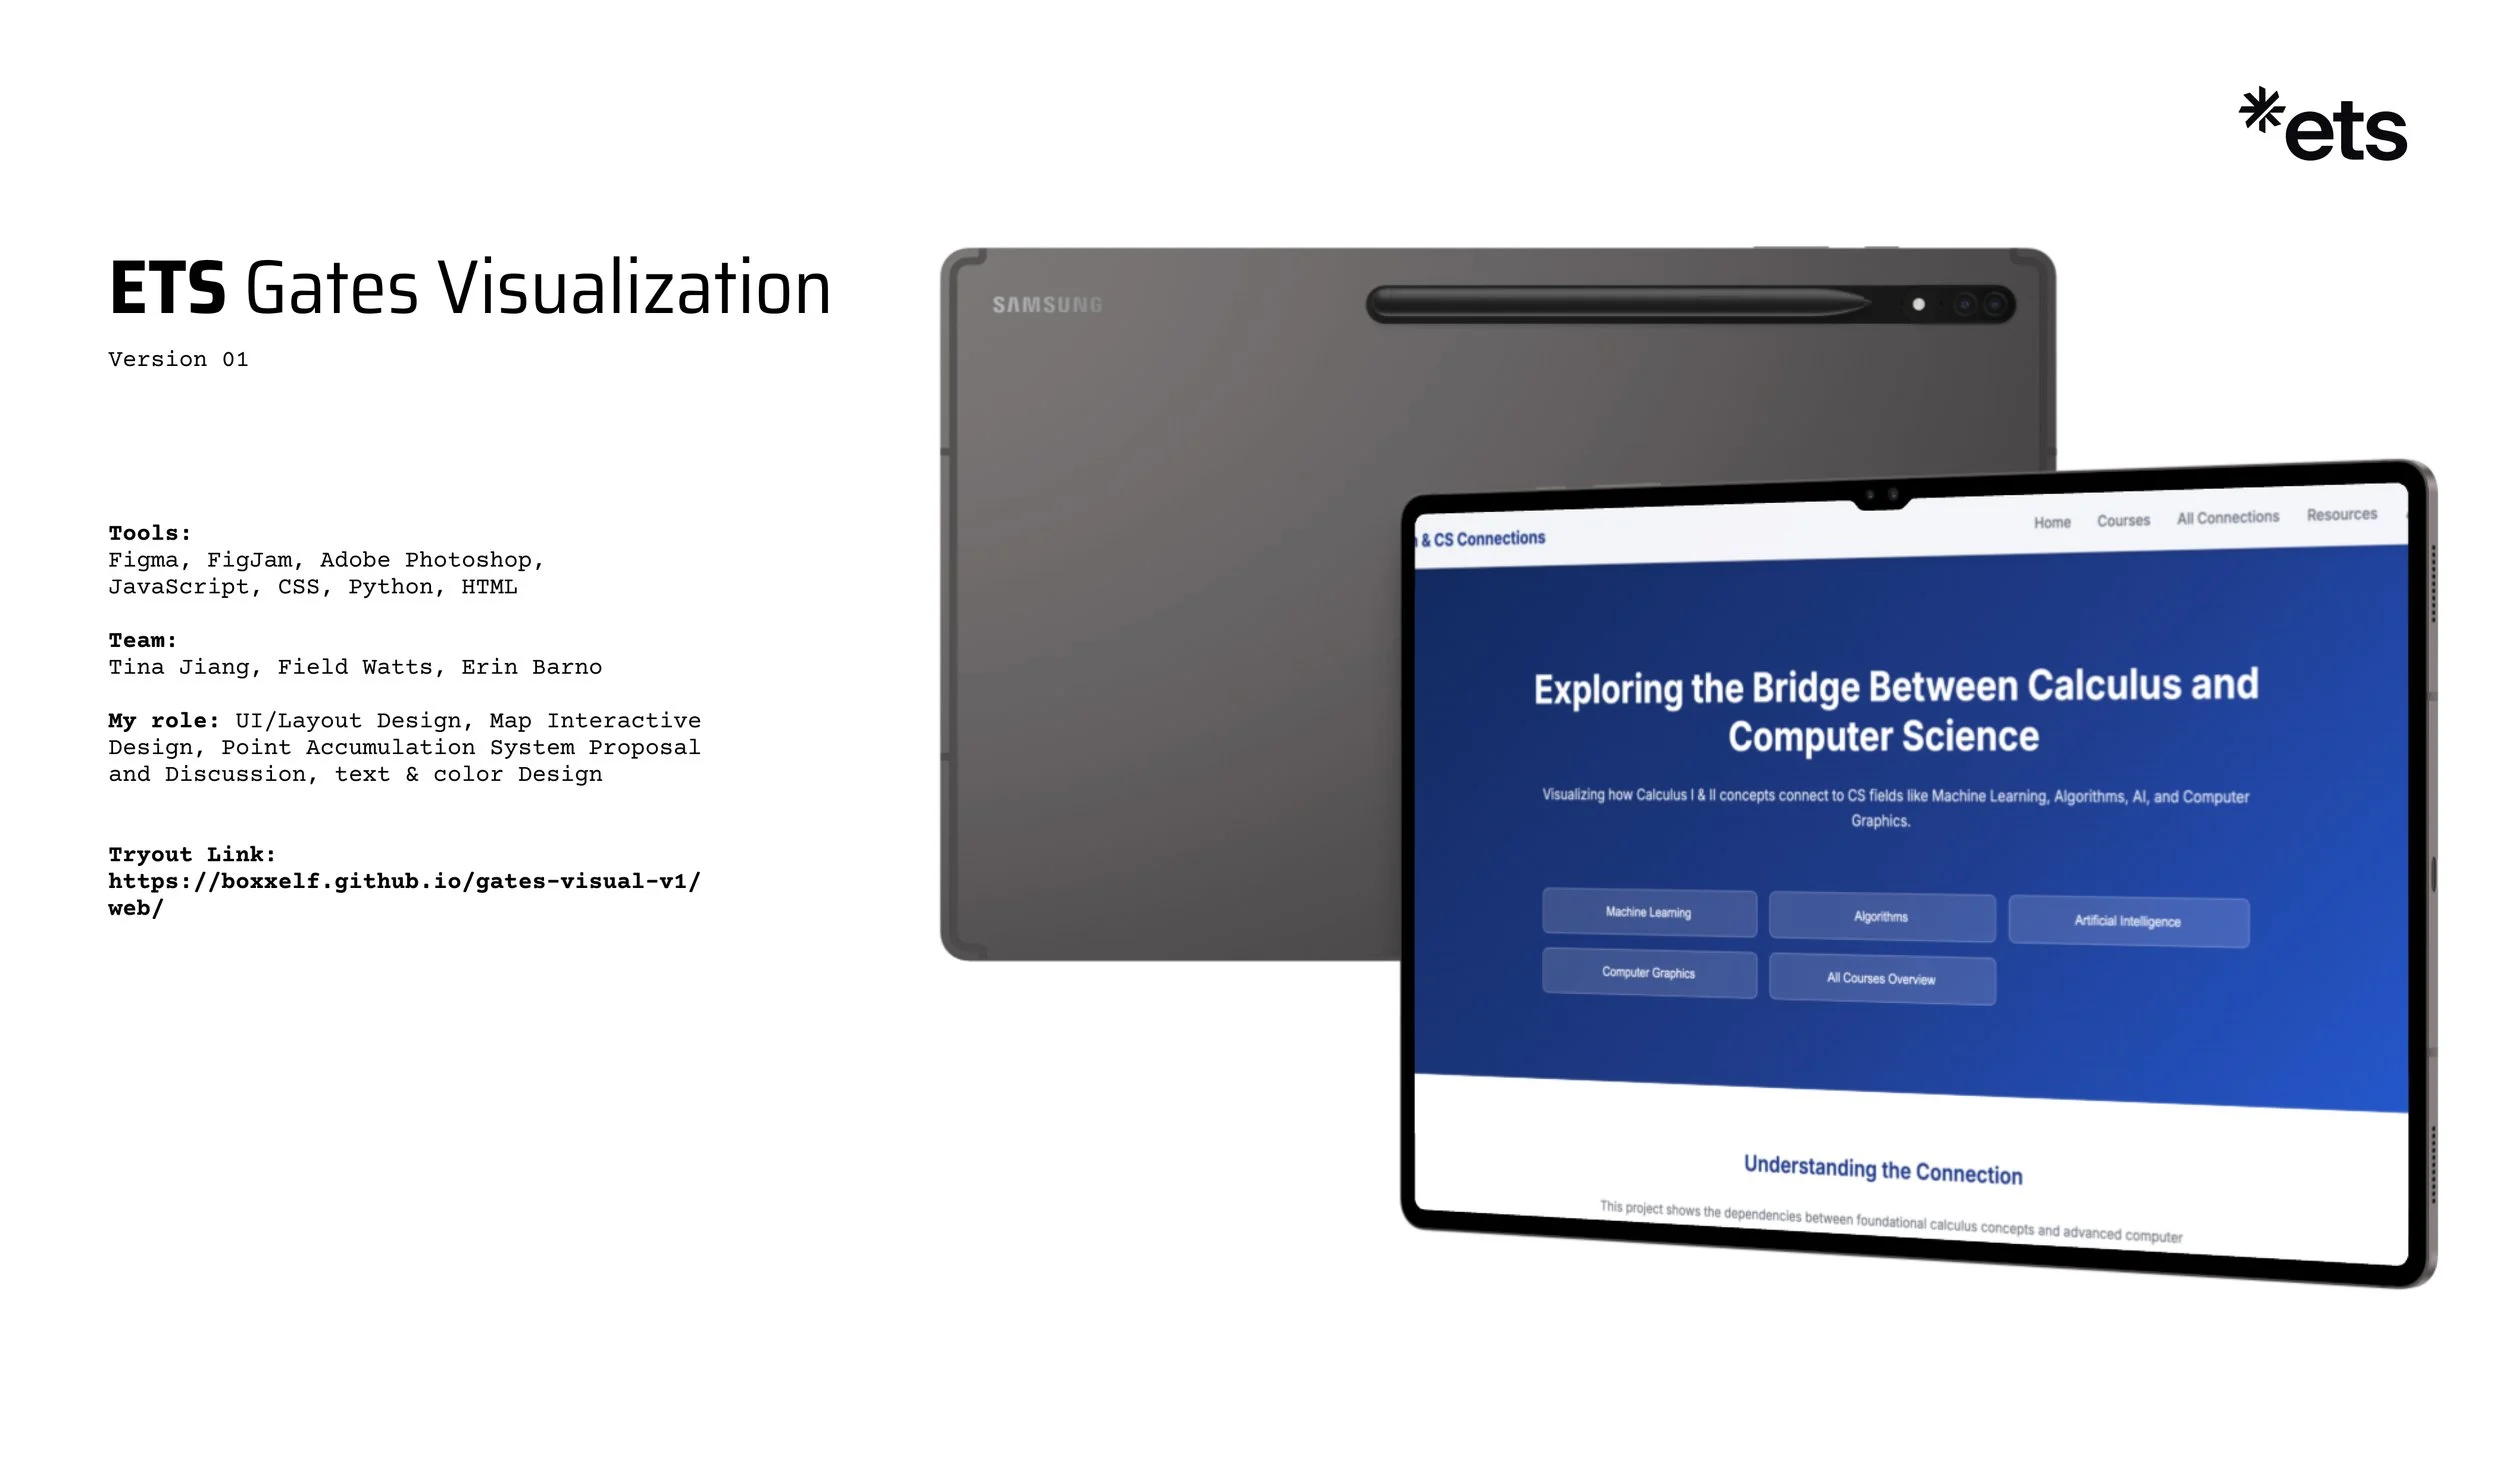
My Role
Developer & Visualization Designer
Designed and implemented an interactive Calculus–CS concept network to visualize interdisciplinary learning connections for educators and students.
Built the front-end system using D3.js v7 to render a force-directed graph with smooth interactions (zoom, pan, node exploration) and responsive performance at scale.
Developed a data-driven pipeline that converts structured concept definitions (e.g., Mermaid .mmd maps) into graph-ready datasets (JSON) to support maintainability and content expansion.
Implemented multi-select topic filtering, ranked list results, and dynamic sorting controls to help users quickly surface the most relevant Calculus concepts per CS topic selection.
Integrated rationale-driven explanations for each connection to make relationships interpretable and instructionally useful—not just visual.
Improved usability through onboarding guidance, empty-state messaging, and transition behaviors that help users understand how the map changes during exploration.
Packaged and deployed the project as a lightweight static site via GitHub Pages, supporting fast iteration and version-controlled releases.
Tools
Visualization: D3.js v7 (force-directed graph, interactive filtering & rendering)
Concept Map Authoring: Mermaid (.mmd) for structured CS topic mapping and taxonomy authoring
Front-End: HTML5 · CSS3 · Vanilla JavaScript
Data Pipeline / Formats: JSON (graph_data.json) · CSV (topic labeling + rationales datasets)
Deployment: GitHub Pages · custom deploy script (deploy.sh)
Version Control: Git & GitHub